What is moloch?
As his own website says: “Moloch is an open source, large scale IPv4 packet capturing (PCAP), indexing and database system. A simple web interface is provided for PCAP browsing, searching, and exporting. APIs are exposed that allow PCAP data and JSON-formatted session data to be downloaded directly.” it will be very useful as a network forensic tool to analyze captured traffic (moloch can also index previously captured pcap files as we will see) in case of a security incident or detecting some suspicious behaviour like, for example, some kind of alert in our IDS.
Thanks of indexing pcaps with elasticsearch, moloch provide us with the ability to perform almost real-time searches among dozens or hundreds of captured GB network traffic being able to apply several filtering options on the way. It isn’t as complete as Wireshark filtering system for example but will save us tons of work when dealing with some filtering and visualization as well as Moloch will provide us with some features Wireshark lacks, like filtering by country or AS.
I’m sure to not be the only who would have loved to rely on moloch when analyzing dozens of GB with tshark and wireshark, particularly each time you apply a filter to show some kind of data…
Installing moloch
For deploying a moloch machine in a “all-in-one” setup i created a virtual machine with Ubuntu server 12.10 64bits and assigned about 100GB of HDD, 16GB of RAM and 4 CPU cores, moloch is a highly consuming platform, to have a more detailed info about this go to hardware requirements.
First step will be updating the box, installing java and cloning github repository:
1 2 3 | |
Once cloned the repo we must install, at least, one of his components: capture, viewer or elasticsearch. Because we are going to mess up a bit with moloch to get an overview of functionalities and capabilities we will take the shortest path, installing moloch through provided bash script to setup everything in the same machine; if you prefer to install it manually or are going to build a distributed cluster check ”Building and Installing”:
1
| |
Now the wizard will make us a few questions to configure moloch (capturer, viewer and elasticsearch instance) for us and everything will be running in a few moments (moloch will be installed by default at “/data/moloch/”) and we can access to web interface at “https://MOLOCH_IP_ADDRESS:8005”:
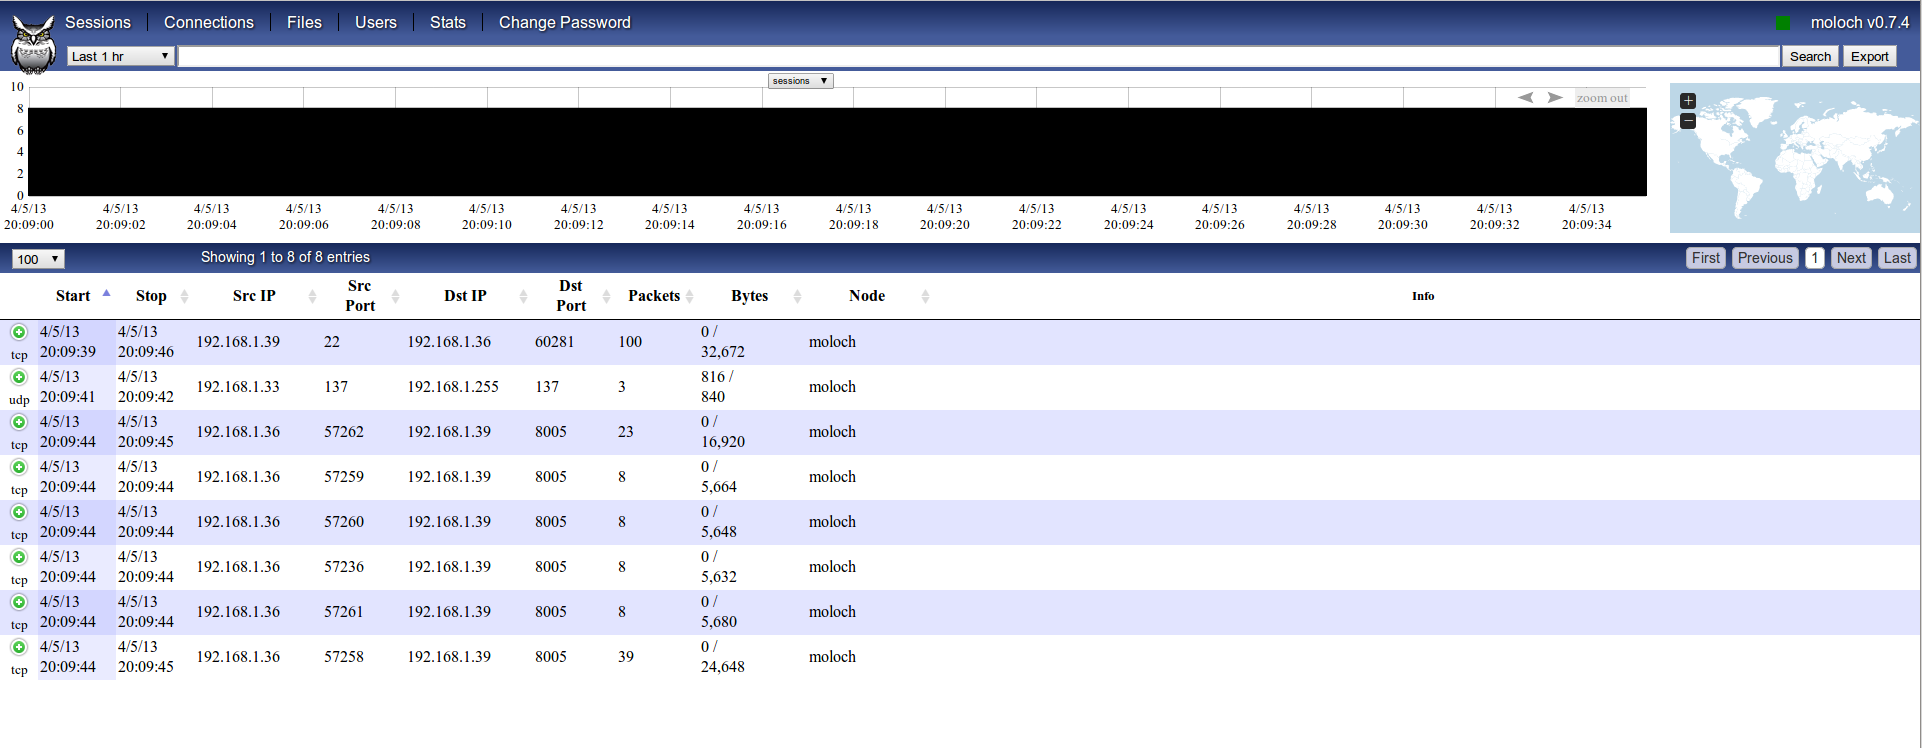
As can be seen, moloch have already started to index all traffic seen on eth0, included every request to moloch web interface. If we don’t want this then we have to specify a capture filtering in Berkeley Packet Filter (bpf) format at “/data/moloch/etc/config.ini”:
1
| |
To change elasticsearch configuration and allow access from other IP address than moloch host itself (it could pose a security risk, using SSH tunneling would be a better aproach) go to “/data/moloch/etc/elasticsearch.yml” and edit network parameters (network.host), to view/change moloch configuration take a look to “/data/moloch/etc/config.ini”:
1 2 3 4 5 6 7 8 9 10 11 12 | |
We need to shutdown elasticsearch node and start it again, so here we go:
1 2 3 | |
We can also start viewer and capturer from same dir “/data/moloch/bin/run_viewer.sh” and “/data/moloch/bin/run_capture.sh” respectively.
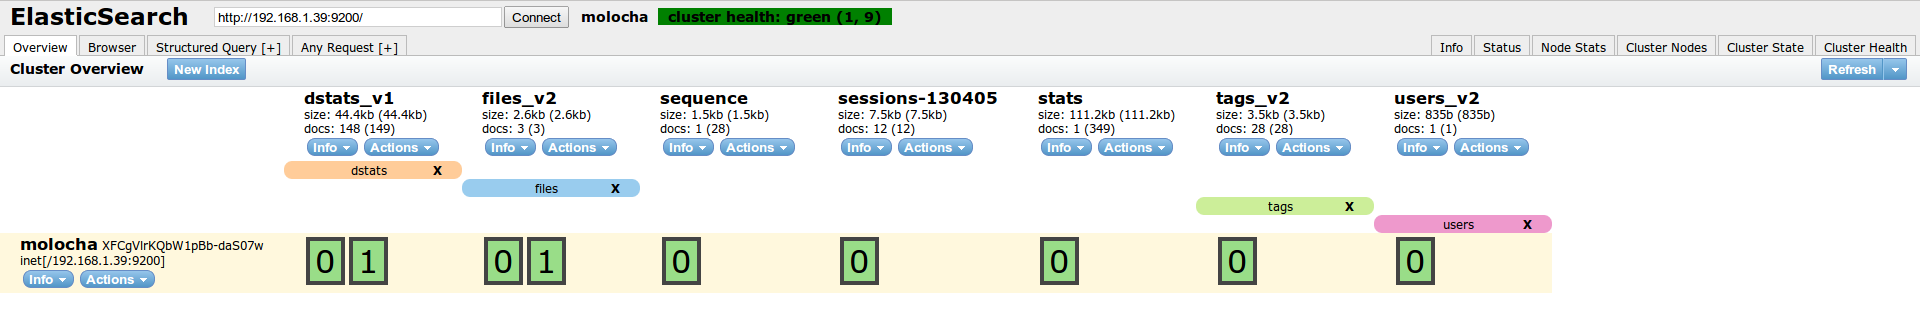
Now we have access to elasticsearch-head plugin to see elasticsearch cluster health and manage it at “https://MOLOCH_IP_ADDRESS:9200/_plugin/head/”:
Moloch overview
To have some info indexed by moloch in a few minutes we are going to make some light random nmap scans, having in mind the interface assigned to virtual machine. If you want to use virtual interface and launch nmap scan from moloch box then you could need to change bpf filter to “bpf=not port (9200 or 8005)” (this isn’t, by far, the correct way, but will be enough for a quick test).
1
| |
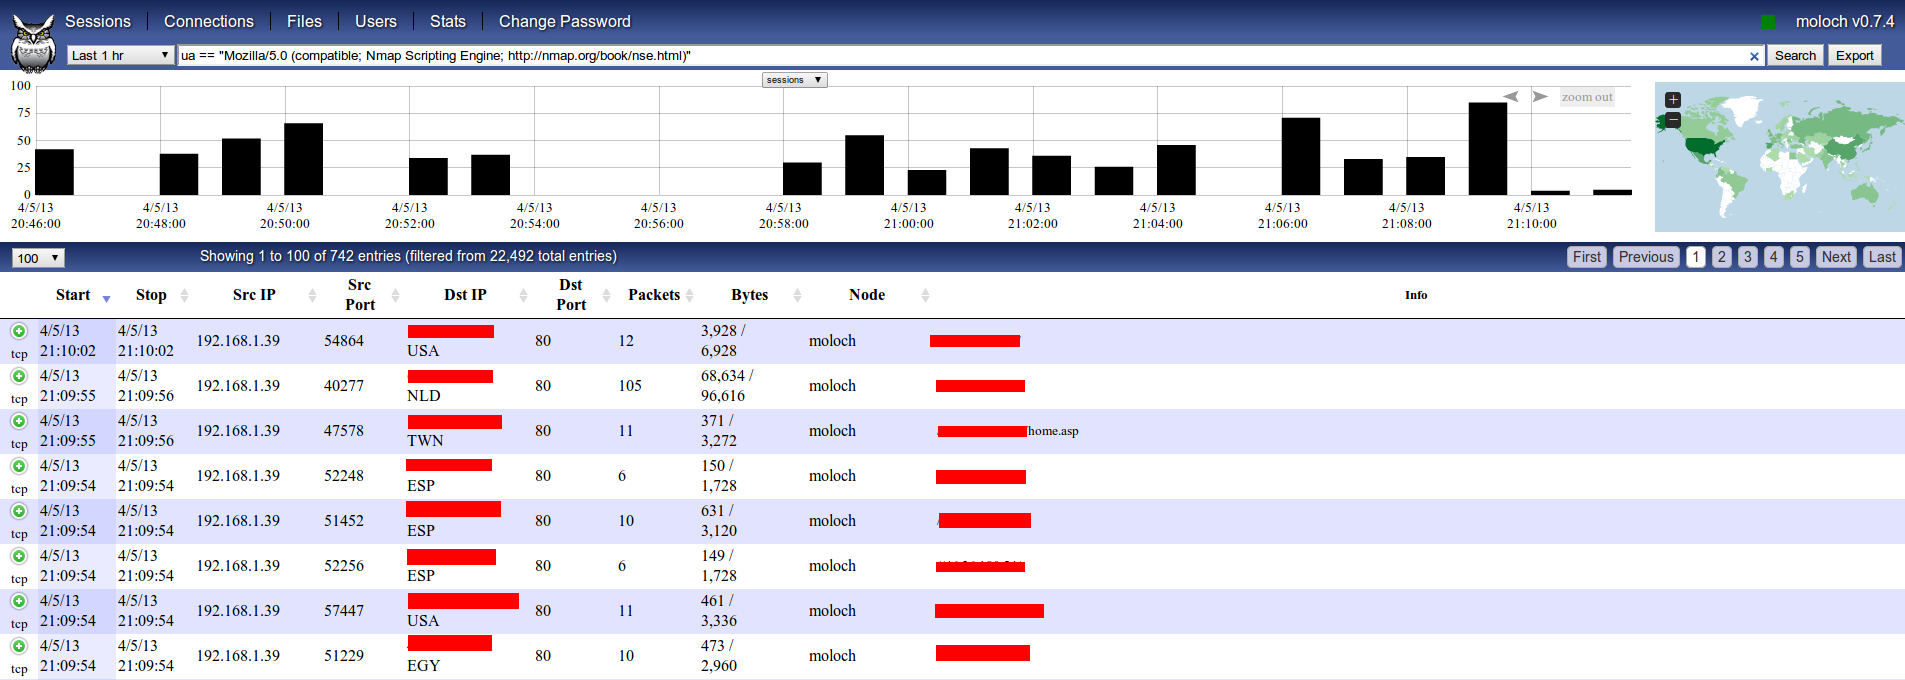
If we take a look again to moloch web interface now we will see some pretty info:
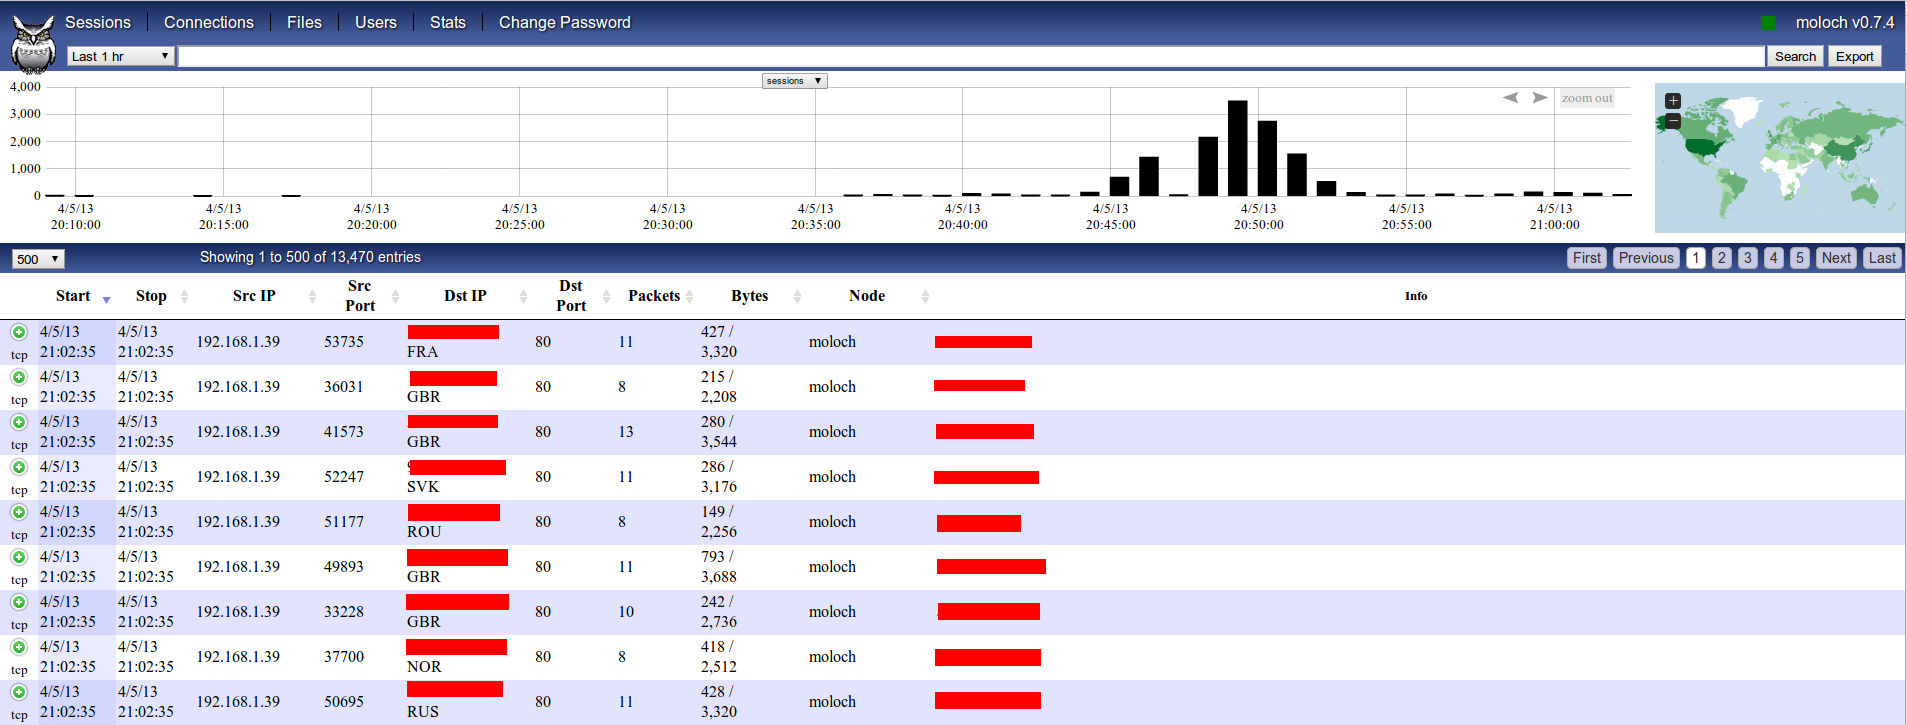
We can see more info about any session clicking on “green plus” icon:
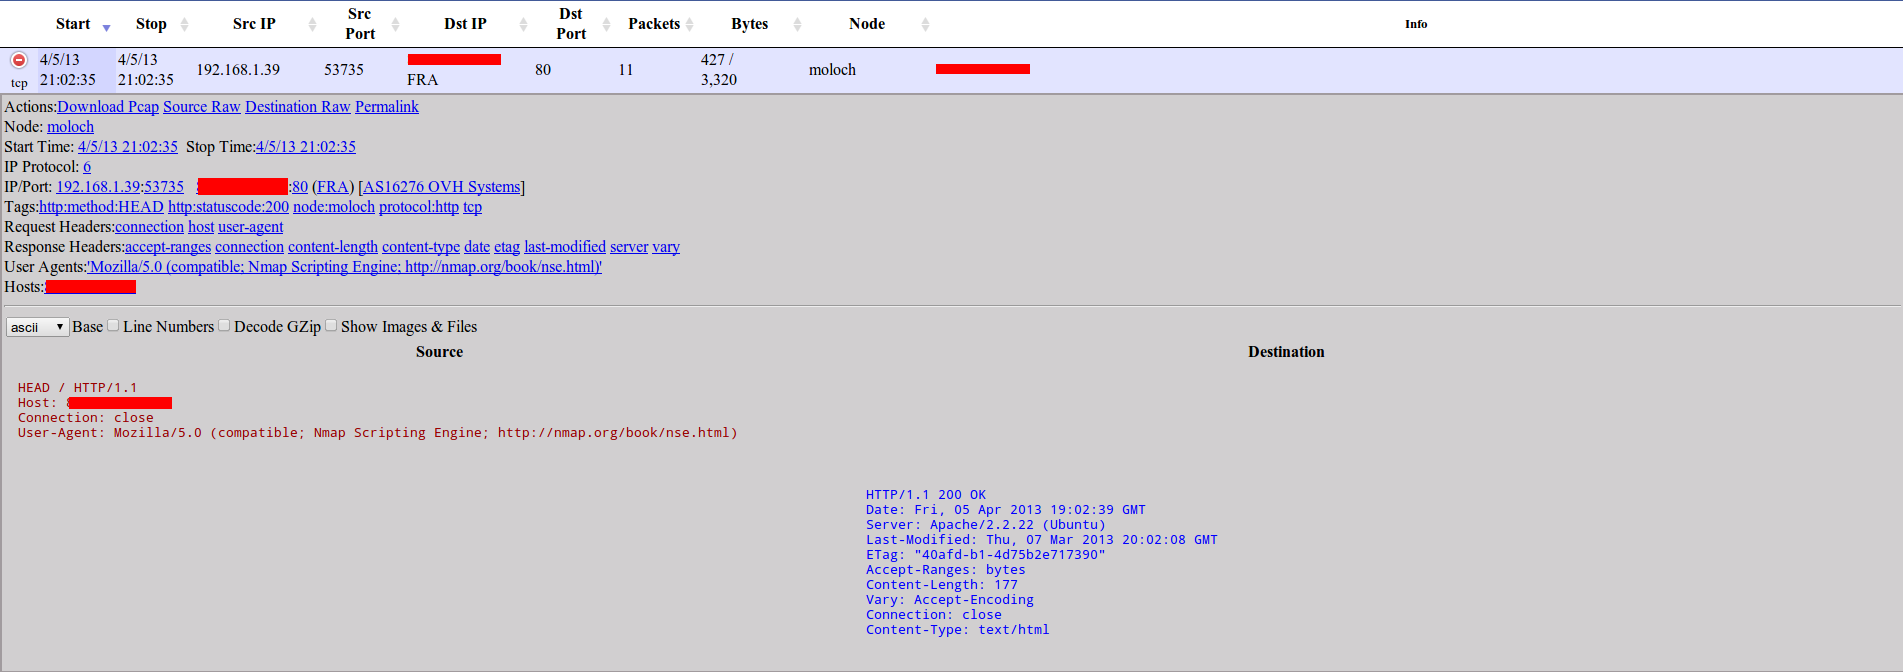
A new dropdown will appear and will give us some interesting options like downloading pcap (for example, to make a deeper manual analysis with wireshark), downloading data in RAW format, and showing use a set of links to make some filtering.
Let’s click on “User-Agent link” and then make a search to show only those indexed packets using the NSE user-agent, now you know who have scanned your network with nmap’s HTTP plugins in just a second ;).
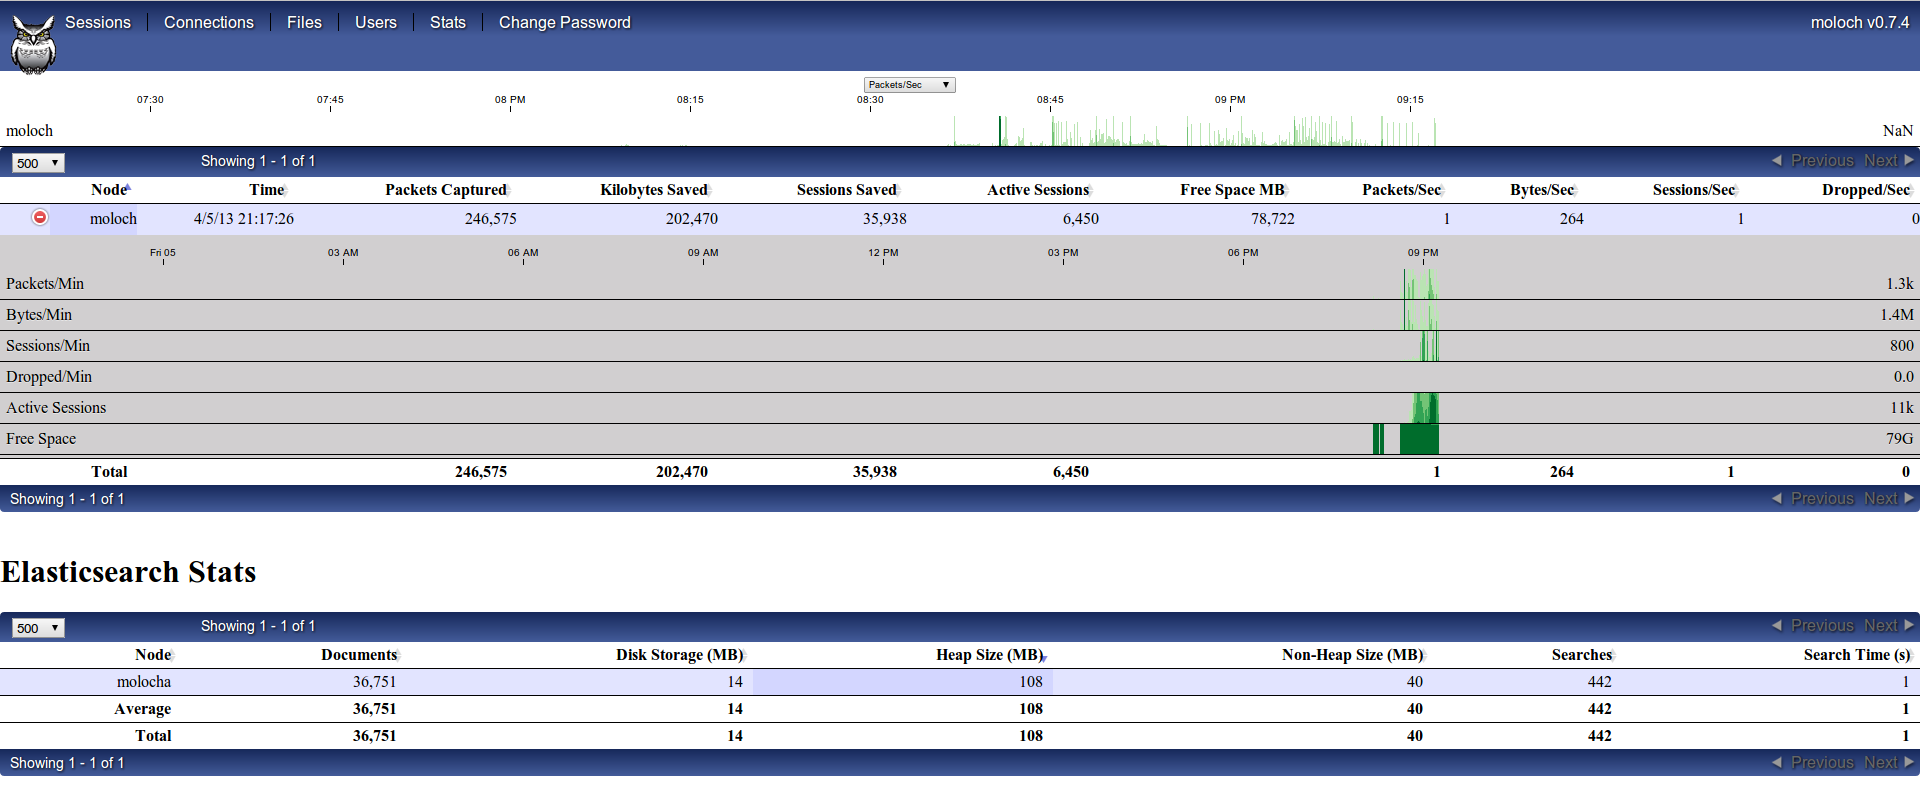
Moloch also have a useful “stats” menu to have realtime statistics about traffic being captured and indexed:
Indexing previously captured traffic
To index traffic captured in pcap format we have to use “moloch-capture” stored in “/data/moloch/bin/moloch-capture”:
1 2 3 4 5 6 7 8 9 10 11 12 13 14 15 16 17 18 | |
I’m going to index a sample of about 7,5GB from a DNS amplification DDoS attack i had to analyze and help to mitigate some months ago, but to quickly download some pcaps to play around NetreseC have a published a good list:
1
| |
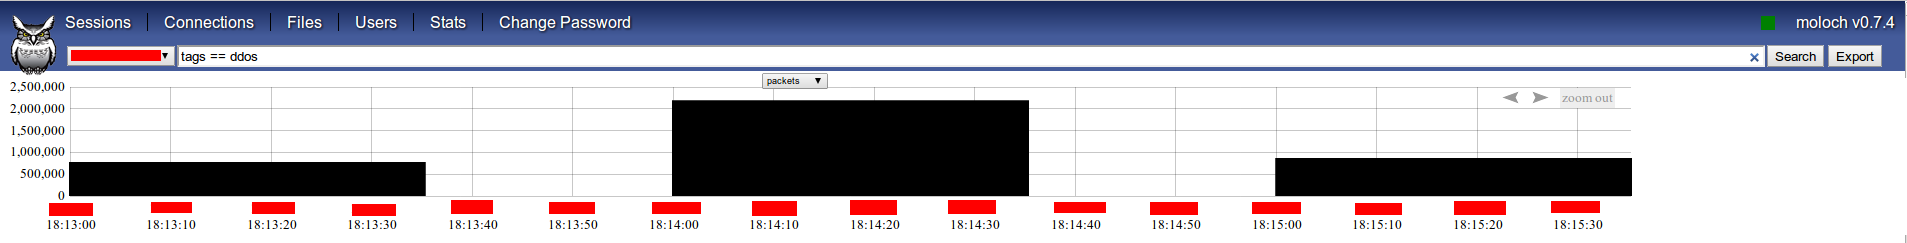
After some minutes i already had indexed some millions of packets and can view them just searching for tag ddos (i have stripped out map and some info to don’t disclose anything about customer / attack):
Let’s say we want to show every DNS datagram originating from port 53 by servers geolocated at Russia:
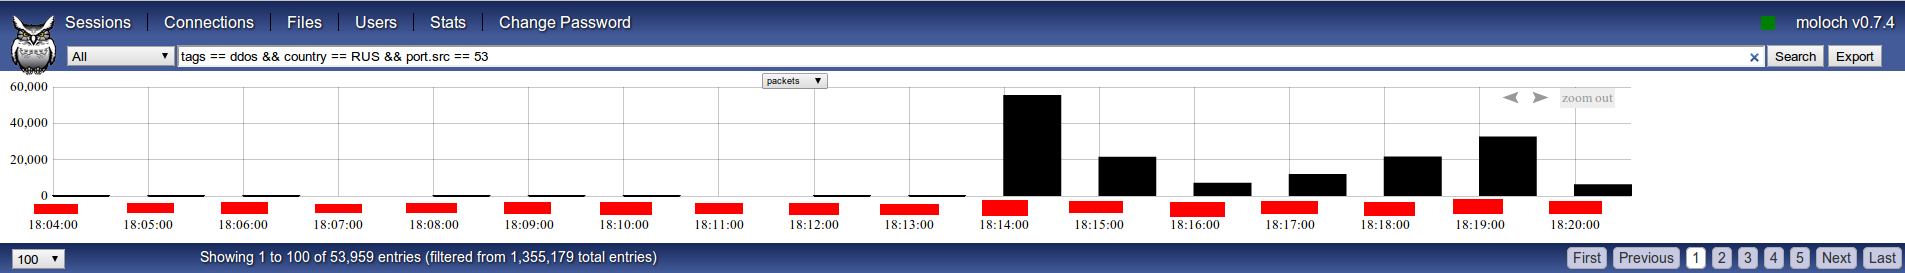
As can be seen, there were peaks of almost 60.000 packets per second (DNS answers) with an average of approximately 20.000 at regular intervals in this six minutes slot.
Moloch give us the chance to visualize indexed traffic from a graph’s theory point of view (“Connections” tab), using hosts as nodes and connections (with or without port) as edges:
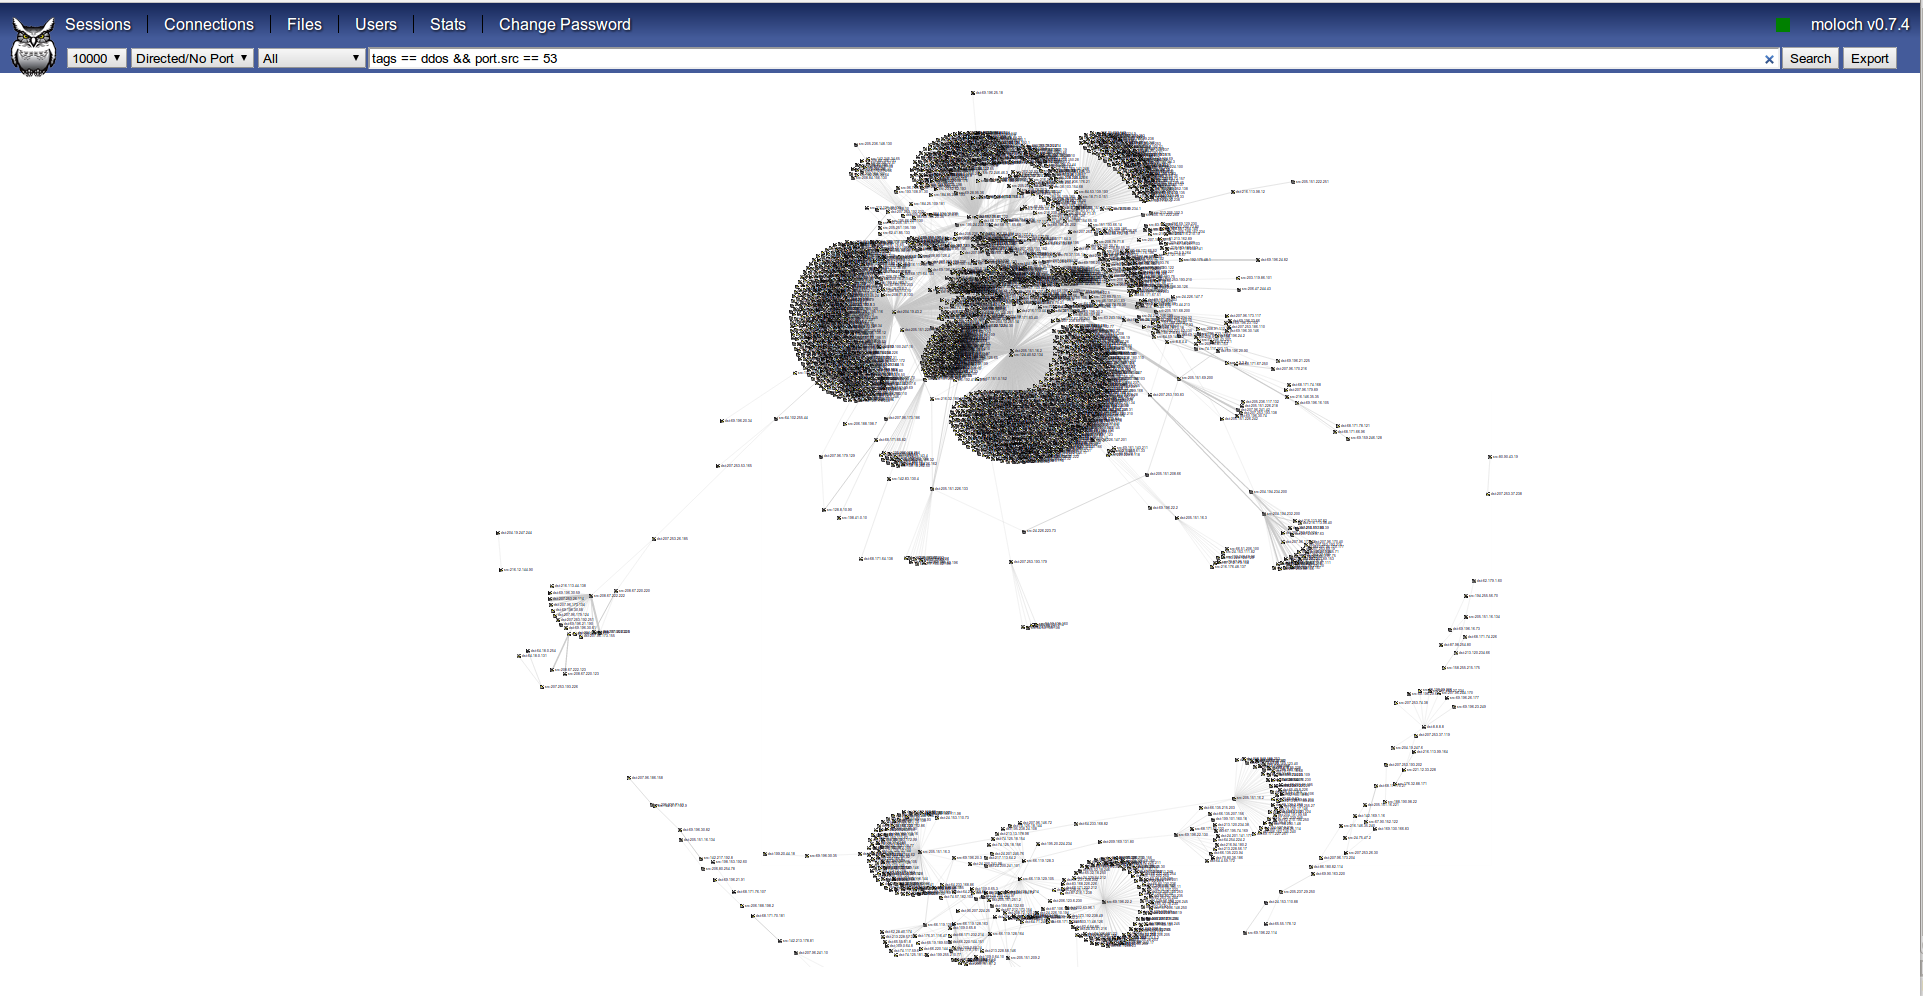
This is really useful to get an idea at a glance of what event is being analyzed, in this case we can easily spot few targets and thousands of hosts targeting them.
Moloch API
At the beginning of this post i said that Moloch have an API to query and get some info about indexed pcaps and so on in JSON format. At this moment probably the best way to see which calls exists is directly reading the viewer code.
There is an example of python code to query moloch API and show some statistics:
1 2 3 4 5 6 7 8 9 10 11 12 13 14 15 16 17 18 19 20 21 22 23 24 25 26 27 28 29 30 31 32 33 34 35 36 37 38 39 40 41 42 43 44 45 46 47 | |
This simple code will show something similar to this:
1 2 3 4 5 | |
That is all for now, hope you liked this and find it useful, i think moloch is a really powerful tool and will turn to a must-have in network forensics as well as saving us countless hours when dealing with big amounts of network traffic.
See you soon!